by Dr.László Zentai
Department of Cartography, Eötvös University
On CAMP '92 Conference, September 8, 1992., Budapest
INTRODUCTION
Computer technology has had an effect on the development of cartography for some years. Both on conferences and in scientific periodicals many papers are available in these topics:
This list nearly comprehends the whole process of map producing, but one of the most important part, the traditional way (editing, drawing/scribing, photo-technical works, printing) began to use computer technology only in input side and generally it was not more than using a digitizing tablet.
Because of the political and economic changes in Hungary and the increase of unemployment we have to make changes in the university training of cartographers. In the years past graduated cartographers were able to find good jobs easily in civil or in military cartography. Now students just finishing cartography training must found their own firms. They must be able to solve all problems themselves in the whole process of map production. The only solution is digital cartography because the traditional way of map producing requires more time and instruments so this method is much more expensive. The students should learn the usage of hardwares and softwares that are
INPUT-OUTPUT
In Hungary the personal computers are mostly IBM compatible PC-s. Because of the COCOM prohibition the Apple-MacIntosh computers - which have very good graphic capabilities - were not available, and now these computers spread only in few places (DTP, colour photo manipulation) especially due to the higher prices. For the works of high level requires lot of graphic operations (like map drawing) are optimal the INTEL 80386 or MOTOROLA 68030 processor based computers.
Any type of hardware we choose it's impossible to find ideal software for drawing and producing any kind of maps. CAD softwares usually not able to define all sorts of area fill and the general graphic softwares are less accurate, their precision sometimes is not meet cartographic requirements. Nowadays in the input side usually CAD softwares and in the output side a powerful graphic software are used.
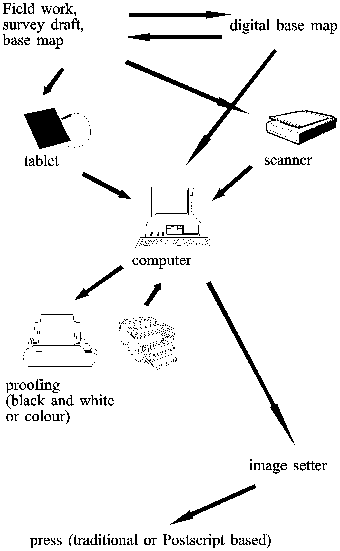
In the computer aided map producing the input side (digitizing topographic maps sheets) is in use in many countries. In the output side cartographers were satisfied with making colour proof with printers or plotters, the printing films were produced photographing these proofs. The photography and screen making as a part of traditional map producing is very slow, requires many material and chemical and the human factor is not neglectable.
The opportunity of whole process' automatization was made possible in the 80s with connection of breakthrough PC-s in DTP (desktop publishing). The main demand of DTP is to make possible handling all kind of page elements (text, graphics, equations, photos, charts) as one unit, such in newspapers and books. These kind of computer systems have existed for 20-30 years, but these were special hardwares with very high prices.
In the 80-s the advantageous change of computers' price/effect ratio made it possible to replace the enormous DTP systems with simple PC-s. Nowadays even the most complex documents are fully editable on a powerful PC.
The other advantageous fact of the considerable development and spreading of copy machines (including colour copiers). The result - because of their similarity to computer printers - the much favourable and less expensive printing possibilities.
POSTSCRIPT PAGE DESCRIPTION LANGUAGE
Postscript is a high level programming language, developed by Adobe to make the description and pass of the whole page (text and graphic information together) to the printer in interpretatable format possible. These Postscript programs (files) are created by certain graphic softwares, so the graphic (eg. map) created by the software is translated by the graphic software itself.
The main advantage of Postscript its device independence: the same file can be printed in 300 dpi resolution on a common laserprinter or even in 2540 dpi on an image setter.
From a cartographic point of view the most important output devices are the image setters (for making printing films in very high resolution) and colour copiers with Postscript interface (for making colour proofs). The new types of image setters (sometimes called laserplotters) are capable for making films in 3800 dpi and exceed the 30 cm wide limit of older image setters. For cartographic purposes 1200-1700 dpi is appropriate, higher resolution is necessary for reproduction of photos in excellent quality.
The image setters may radically alter the process of map producing. After DTP we may learn a new term: Desktop Mapmaking or Computer Aided Map Producing (CAM), which not only alter the traditional technology, but the graphic possibilities become more and more powerful due to the Postscript language. The CAM may significantly change the look of maps in the future, so these new functions requires theoretical examination too.
The new Postscript based colour laserprinters or copiers may make the traditional printing (press) unnecessary, because some users would like only few examples (max. 100). So the use of these kind of equipment is less expensive (and much faster) than the traditional printing.
SOFTWARES: INTENTIONS AND POSSIBILITIES
For cartographic purposes, especially for CAM aims we may use general programs (CAD or graphic softwares) or special cartographic softwares:
BUDAPEST - CONFLICT MAP SERIES
For the order of Budapest' City Council more than 30 thematic maps were produced at the Department of Cartography (Eötvös University), which maps were described the largest problems and conflicts in the capital. There was very few times for drawing these maps, but this was not the only reason to make these maps by computer.
The base map (road network of Budapest) has been ready for some years. The first problem was the conversion of this file into the graphic software (CorelDraw 2.01). The road network originally was digitized in ARC/INFO. There was two vector format available in both the source and destination softwares: DXF and HPGL. Through DXF is a CAD standard in file conversation, CorelDraw was not able to read the ARC/INFO DXF file correctly. Fortunately there was no problem with HPGL format. Because of the storage method of CorelDraw (the size of graphic objects can't exceed 64 kB, which means that a single object can't be more nodes - polygon points - than 4000). The separation of district boundaries, capital boundary and roads were no more after conversion, so it must be reorganized in CorelDraw. The map elements got different attributes also in the graphic software (dashed or dotted lines).
Because of the lot of base map data and the detailed thematic content the file sizes temporarily exceed the suggested maximal file sizes (number of drawing objects). After drawing all of the thematic information to the map it was possible to delete the base map so the file size changed acceptable.
The main difference was a selection of colour model. The SPOT method is traditionally used in cartography (this means the all used colours will be printed with separate ink, so as many colours we used as much will be printed). An another method were chosen - called PROCESS, that is the CMYK (cyan-yellow-magenta-black) - so we used only for colours for printing.
CorelDraw allow to design nearly favourable filling (any colour, raster, vector and Postscript) - this function were used very often. But not all of the fillings were totally accepted by the Postscript interpreter, so the image setter were not able to make the printing films.
CONCLUSIONS
CorelDraw is a good example of less expensive, but very powerful graphic (illustration) softwares. This programme is capable to draw nearly every cartographic element, but not all of them may draw easily. To create some of the special filling and line types sometimes very difficult and time-consuming.