Fig 1 - Example of one of the FAO world climate maps, in this case the precipitation map for the month of April. Note the fourteen classes. From: http://www.fao.org/WAICENT/FAOINFO/sustdev/EIdirect/climate/EIsptext.htm
SOME USES OF THE WEB IN CARTOGRAPHIC EDUCATION
Having been in existence less that a decade, the web has changed the ways we do many things. In these last ten years the cartographic community has taken advantage of the resources offered by this environment. The web has had an influence on cartographic education and its impact should continue to grow.
As Chair of the Map Use Commission (1995-1999) of the ICA I contended the web offered a different map use environment because with the existence of the web users are able to access and interact with maps in ways they could not in the past. This author has taken advantage of this environment to employ maps in cartographic education at many levels in a university environment. This paper is an overview of the many ways I use the web for cartographic education.
The author is a professor of Geography and integrates units on cartographic education in most of the courses he teaches. I do not teach a cartography course nor a GIS course specifically, so I have to inject my thoughts on cartography and maps into those courses I do teach. The courses I teach or have taught that have involved maps on the web are a general education course for first-year students, a weather course designed for hundreds of students at a time, a course in physical geography and a techniques course that serves as a pre-requisite for coursework in cartography and GIS.
The Web as a Source of Maps
One major use of the web is the source of information, including maps. If you want to explore what is available on a particular subject today, it is reasonable to turn to the web and employ a search engine to find information about that subject. Because we have learned to do this, all too often we turn to the web when we should be using the traditional sources of information.
On the other hand, the web is able to deliver data that are most current and as such there can be no other source of such information with such currency. Of particular note are the many maps showing recent and forecast weather. Of a similar note are the maps of such environmental conditions as drought in the conterminous United States. In these cases the maps are made available as soon as the maps are created and released to the public. Thus, in this regard the web becomes the prime source for many maps and thus cartographic information. Because the web exists we have an obligation to teach persons how to work in this cartographic environment.
Case Studies on the Use and Abuse of the Web
It should be noted that in many cases the web makes the publication and distribution of maps basically free and quite convenient. It is easy to place maps on the web for viewing by the world and because of this ease of display the web has been abused. The nature of the web is such that we can find maps on the web that most contend should not be there. Two examples come to mind.
About four years ago I searched the web for maps of Bosnia / Herzegovina. I hit upon a site with a very interesting map of the area and therefore explored the site. The site was maintained by an individual with ethnic roots in the area and this person expressed his thoughts about what was happening in his homeland. The author of this site included a large amount of information about his homeland, including complete map coverage with a multi-panel tourist map of the area. The author of the site acknowledged that these map panels were from a published source with this statement:
"These maps have been scanned from the "New Roadmap of Croatia,
Slovenia, and B&H" published by publishing house "Naprijed"
in Zagreb, Croatia in1995. Proper permission for posting has been requested
in May, 1995. No reply has been received yet. So we decided to post these in
the interest of the public anyway. If you use any of these, please keep in mind
the copyright laws and a common sense use."
Quoted from : http://www.kakarigi.net/maps/
March 24, 2002
It is apparent that these maps do not belong on that site but because the publisher or distributor of the maps has not taken action to have the maps removed they are still there for the world to see. It is important that we in cartography let our students know that such use of the web is ethically wrong and probably illegal.
The second abuse of using the web for the display of maps concerns a scientist working for a contractor for the U.S. Geological Survey, a federal agency in the United States government. This scientist had used the web to display a great number of maps of environmental topics. I, like most of the world, only heard about the activities of this scientist after his web pages had been removed so I cannot speak first hand about what was shown on his site. We learned about Ian Thomas and his maps when he sent an email to many environmental groups. I received at least two copies of his email through my environmental and cartographic links. Then I read an article about him in the Los Angeles Times. (2001). Two months later the Washington Post (Grunwald, 2001) told the story in a more reflective time. (Note: a search on the web under "Ian Thomas maps" will give many hits on this subject.)
As a former employee of USGS and after reading these many items, it is obvious to me what happened. Thomas's web site bore the address "usgs.gov" and as such it implied that the content of the site was sanctioned by that federal governmental agency. The scientist put up a great number of maps on this site. At least one of these maps was identified as having erroneous or misleading information. At some point the management of the U.S. Geological Survey became aware that this individual was displaying on the agency web site maps that had not gone through the normal review process and therefore removed those maps from the site. Because some of the maps displayed by this scientist on this site related to a politically sensitive environmental issue, the assumption was that the government suppressed dissent. The agency denies this was the case and I see merit in the argument of the agency. Of course, the agency is guilty of letting individuals post material to the agency web site without authorizing the content and image of that material. It is not appropriate for an individual to have the power to set the agenda of a large agency. Anything posted to the agency web site reflects on the policy and practice of that agency. I believe that had this scientist displayed those maps on a personal site paid for by the individual, independent of the federal agency, then we would never have heard about this situation. Again, this is a case study for students of cartography.
So, one aspect of the web in cartographic education is to show how the web is being used and misused. There are many good examples of the use of the web and we should point them out when we see them. In 1996 I presented two papers in ICA Commission seminars on good uses of the web for the distribution and presentation of maps. (Carter, 1996a, and 1996b) While those papers demonstrated good use of the web, there was one case of abuse noted.
The Use of the Web for Presentation of Material to Students
Just as the web has become a source of information, it also serves as a medium to deliver information. We now see the development of web-based packages designed for the delivery of instructional material. At my university we have licensed two such programs: Mallard and WebCT. I developed a weather course using WebCT. This course was designed to be delivered to hundreds of students at a time. Students must have a password to enter this package and work on the course material. Thus, it is a secure environment available only to the students in the class.
With WebCT I am able to present web pages for student viewing, give self-tests that provide immediate feedback, give online tests that will be graded and scored, maintain a calendar with information for the students about the class, maintain discussions on various topics relevant to the class, and post student grades that only the individual student can see. These are fairly complex packages, but they offer much potential. I contend these packages represent a unique map use environment and it is incumbent that we cartographers find ways to take advantage of these environments.
The textbook for the weather course focuses on North America and assumes that students are comfortable reading maps. Based on my experiences teaching weather and climate for many years, I feel that students need an introduction to maps and map reading as a foundation for the study of the atmospheric sciences. To provide that base I created a number of map-oriented presentations and exercises within WebCT to give the students a better concept of our spherical Earth and to help them read the maps found in the text.
The first set of exercises relate to showing the spherical Earth on flat maps-map projections and the inherent distortions of the different projections. Then the students are taken through a collection of world climate maps showing temperatures month to month and another set of maps showing precipitation month to month. (FAO, 1999) These two sets of maps are also available as animated GIF files. Those animated files are presented to students and they are taught what to look for among the many things shown on the maps. These sets of maps make up most of the substance of the beginning part of the course and by the time the student has gone through this material he/she should have knowledge of the nature of our rotating spherical Earth and the distribution of temperature and precipitation climates across the land surface of Earth.
Fig 1 - Example of one of the FAO world climate maps, in this case the precipitation
map for the month of April. Note the fourteen classes. From: http://www.fao.org/WAICENT/FAOINFO/sustdev/EIdirect/climate/EIsptext.htm
Next images of global weather are introduced--weather being the behavior of the atmosphere at any given moment. To show global weather a series of maps from the Space Science Engineering Center at the University of Wisconsin (SSEC) are employed. These maps represent the power of cartographic resources available via the web. The SSEC maps show four themes: temperature of the land, temperature of the oceans, the presence of ice, and cloud cover. The maps are based on classified satellite imagery fit to the equal-area Mollweide projection. A new map is posted every six hours and users can download a loop of maps covering the past week. These are powerful, but complex, representations and considerable effort is devoted to helping the students read these maps.
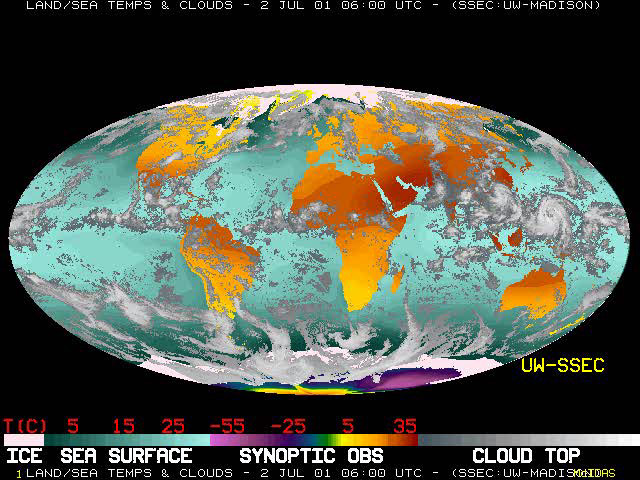
Fig 2 - Example of the Global Composite Map from the University of Wisconsin
Space Sciences Engineering Center (SSEC) for 06:00 UTC, 2 July 2001. For the
current single image and movie: http://www.ssec.wisc.edu/data/composites.html
Many of the maps in the textbook have been scanned into WebCT and in many cases I spend some effort teaching about those maps. In one case I criticize the color order of a map from the text and rearrange the colors to show how the map could be more effective. In other cases I zoom in on a portion of a map to emphasize something the students need to see. It is unlikely they would see these things without focusing on the major points.
There is yet another collection of maps that are brought into this class. During the school term we experience some interesting weather. In more than one case I have captured a collection of weather maps showing the progress of a weather event as portrayed on maps. I would not use these maps if my site were viewable by the public because I do not have the right to show such images in public space. But, it is my interpretation that for education purposes I can use selected maps in my secure environment to portray such events. I make a special point to provide citations and links to all of the maps so employed.
Having the Students Create Their Own Web Pages
At my university all students and staff are given space for posting web pages. I am an advocate of teaching students to use the technology available to them and for this reason I make a concerted effort to teach students how to use their web space as I teach them about maps and cartography.
There are a number of reasons to have students create their own web pages. First, this is a technology that is very important in the academic and scientific communities and our students need to have actual experience using this technology. It is important for everyone to be aware of how easy it is to create a web page, in part so that each individual can better assess the validity of sites on the web. We teach students that items published in the peer-reviewed literature have gone through a review process and therefore this work is the best we have to offer. By contrast, viewers of the web need to know items placed on the web may not have gone through any review and might have been published by someone like them.
If one already has access to the Web, it is an inexpensive medium for the presentation of material. In one class of 30 students I wanted each student to go to the web and create a set of colorful choropleth maps using interactive software at the web site. If I were to have those 30 students print at least four maps apiece, this would have been a large load on the printers and it would have been very expensive. Instead, I had the students post their maps on their own web spaces. Certainly, this saved physical resources as well as giving the students experience using a new tool.
Another advantage to having students post their class work on their personal web site is that the students know their work will be seen not only by the instructor but will be available for the entire world to view. In some cases I have set up a master page relative to the class project and from this page the world can click on links to the individual student pages. Sometimes I have had students work together to help each other build and edit their pages on the assumption that students will learn by editing and critiquing each other's work. I have also had students write evaluations of a fellow student's web pages, addressing specific points. Thus, the students writing web pages generally do so under the glare of public scrutiny.
In our physical geography text (Christopherson, 2000) there is a discussion of hypsometry of the world. Relative to that topic is an interactive mapping site supported by Lamont-Doherty Earth Observatory (LDEO). The organization maintains a complex web site emphasizing their many scientific activities. Under their Climate Modeling Group they have an Open House designed for the public. Included here are many map presentations including an interactive program to let the user create his or her own map of hypsometry for the world. Here is an example of a map created at that site.
Fig 3 - Map of world bathymetry created by the author at the Color the World
web site sponsored by Lamont Doherty Earth Observatory. To make your own map:
http://rainbow.ldeo.columbia.edu/exhibits/worldcolor/
It takes little effort to create a map with this interactive program and for this reason it is a good place to introduce students to many of the decisions one has to make in creating an effective map. Accompanying the site is a Gallery where users can post their creations for the world to view. Scanning through the Gallery one will see maps created by persons of all ages, including many done by children. I put my own grandson on this program when he was 9. He created a map but had little understanding of what he had done. By contrast, I know of a girl of 14 who spent most of one day at this site crafting maps of elevation and bathymetry.
I take my students to the LDEO site and have each student create a collection of at least three maps and integrate them into a web page. I have an introduction to the exercise and build a link to each student's collection of maps. I have background information on the LDEO site and recognize the creator of the site. I have corresponded with him and have his permission to maintain these pages. Many of the maps the students have created employ colors that do not appeal to me, but those are their choices. On the other hand, many of the maps the students have created show that they worked at creating maps that answer specific demands. In the process they learn about the use of color in cartography, the importance of class intervals and gain knowledge about the hypsometry of the Earth and the individual continents. Working with this package dramatically illustrates the lack of relief in Australia and the great height of Antarctica. Link to my introduction to the LDEO maps and the student projects at: http://www.ilstu.edu/~jrcarter/LDEO/
In my Geographic Techniques course the students are introduced to many different types of maps and to some of the procedures involved in creating those maps. As a hands-on introduction to choropleth maps, I sent the students to two web sites set up to let the user create his / her own choropleth map. Each student was asked to create two maps at each site--both maps showing the same thing but differing in terms of the options set in making that map. As such they could change the number of classes, the system of class division and the color series. They were then told to post those maps to their web site and discuss the process of making choropleth maps.
One site is the American Fact Finder, supported by the U.S. Bureau of the Census. The other site is CIESIN, the Center for International Earth Science Information Network, at Columbia University. The mapping programs at these two sites give a person many options, but the sites are designed to be used by a public which has little knowledge of maps and mapping. By walking my students through each site the students are soon able to make simple maps. It takes an understanding of the nature of choropleth maps and a desire to complete a good map to get a good product. But, good products can be created, as is evident in two examples from my students. I created an online discussion on the Choropleth Map for my class and from that site I have links to the pages of two students. http://www.ilstu.edu/~jrcarter/Geo204/Choro/ In these examples the students did all I told them to, and more.
In my Geographic Techniques class I also introduce the students to latitude and longitude and how it can be represented in degrees, minutes and seconds as well as in decimal degrees. This is not an idle exercise for the TIGER Mapping Service of the U.S. Bureau of the Census requires that users define the center of an interactive map in decimal degrees. In addition to the decimal degree, north and south, east and west, must be specified by positive and negatives. Thus, my home area in the central part of the United States is at coordinates 40.5 degrees by -89.0 degrees. A good test of student's comprehension of such coordinate systems is to send them to the TIGER Mapping Service and have them create a map and include it on their web page. I did not have them do that this year, but they will next time.
Concluding Remarks
The web has become an important part of my teaching, as it has for many others. Yet, as I write this I feel compelled to note that much of my teaching about and with maps does not involve the World Wide Web. There are many things I want students to do to learn to create and use maps. Some of those things can be done online today. Some may be able to be done online in the near future. And, I suspect there are some things that never can be done as effectively online as they can be done in the traditional, analog form. This has significance for cartographic education, for we now have an obligation to extend our teaching over a variety of media. While the web has made it easier to find and deliver maps and cartographic instruction in many cases, it has not replaced traditional media. The web belongs in cartographic education, but it is only one of many technologies that belong there.
References
Ahrens, C. Donald, 2000, Meteorology Today: An Introduction to Weather, Climate, and the Environment, 6th ed. Brooks/Cole
Carter, James R., 1996a, "Spatial Data Use in Cartography," Proceedings, IV Congreso Internacional De Ciencias De La Tierra, Santiago, Chile, 5 - 9 Augosto, 1996, pp. 255-260.
Carter, James R., 1996b, "Maps for Children on the World Wide Web," Proceedings of the Seminar on Cognitive Map, Children and Education in Cartography, held at Gifu Prefectural Library, Gifu, Japan, November 8-10, 1996. pp. 147-159
Carter, James R., 1999, "Cartographic Education as a Foundation for Atmospheric Science Study," Proceedings, 19th International Cartographic Conference, Ottawa ICA, Section 4, pp. 149-156.
Carter, James R., 2001a, Web page for Geo201 Physical Geography class, Spring 2001, showing student projects. http://www.ilstu.edu/~jrcarter/LDEO/
Carter, James R., 2001b, "Map Use in Secure Web-based Instructional Environments," Proceedings, 20th International Cartographic Conference, Beijing
Christopherson, Robert W., 2000, Geosystems: an Introduction to Physical Geography, 4th ed., New Jersey: Prentice-Hall, Inc.
CIESIN, 2002, Center for International Earth Science Information Network http://www.ciesin.org/
FAO, Agrometeorology Group (1997), Environment and Natural Resources Service (SDRN), FAO, http://www.fao.org/WAICENT/FAOINFO/SUSTDEV/EIdirect/CLIMATE/EIsp0001.htm
Grunwald, Michael, 2001, "Myth of the Martyred Map Maker Fired Contractor Turned Into Hero," Washington Post, May 20, 2001. http://www.washingtonpost.com/wp-dyn/articles/A53125-2001May20.html
LDEO, 2002, Lamont-Doherty Earth Observatory, Columbia University, http://rainbow.ldeo.columbia.edu/exhibits/worldcolor/
Los Angeles Times, 2001, article about Ian Thomas being fired as a contractor for USGS and the maps he published on the USGS web site, probably March 15, 2001 http://www.latimes.com/news/nation/20010315/t000022700.html
SSEC, 2002, University of Wisconsin, Space Science and Engineering Center, satellite composite images, Global Montage, at: http://www.ssec.wisc.edu/data/composites.html
U.S. Bureau of the Census, 2002, American FactFinder web site. http://factfinder.census.gov/servlet/BasicFactsServlet
TIGER Mapping Service, 2002, U.S. Bureau of the Census web site: http://tiger.census.gov/cgi-bin/mapbrowse-tbl
WebCT, 2002, http://www.webct.com/